Get insights into how your published documents perform with Craft’s built-in analytics. Track views, understand your audience, and measure engagement – all while respecting reader privacy.
Published Content Analytics is available on all paid subscription tiers: Plus, Family, Team, and Business.
Accessing Analytics
You can view analytics data in two different places within Craft:Published Content Folder
Access analytics for all your published documents in one place: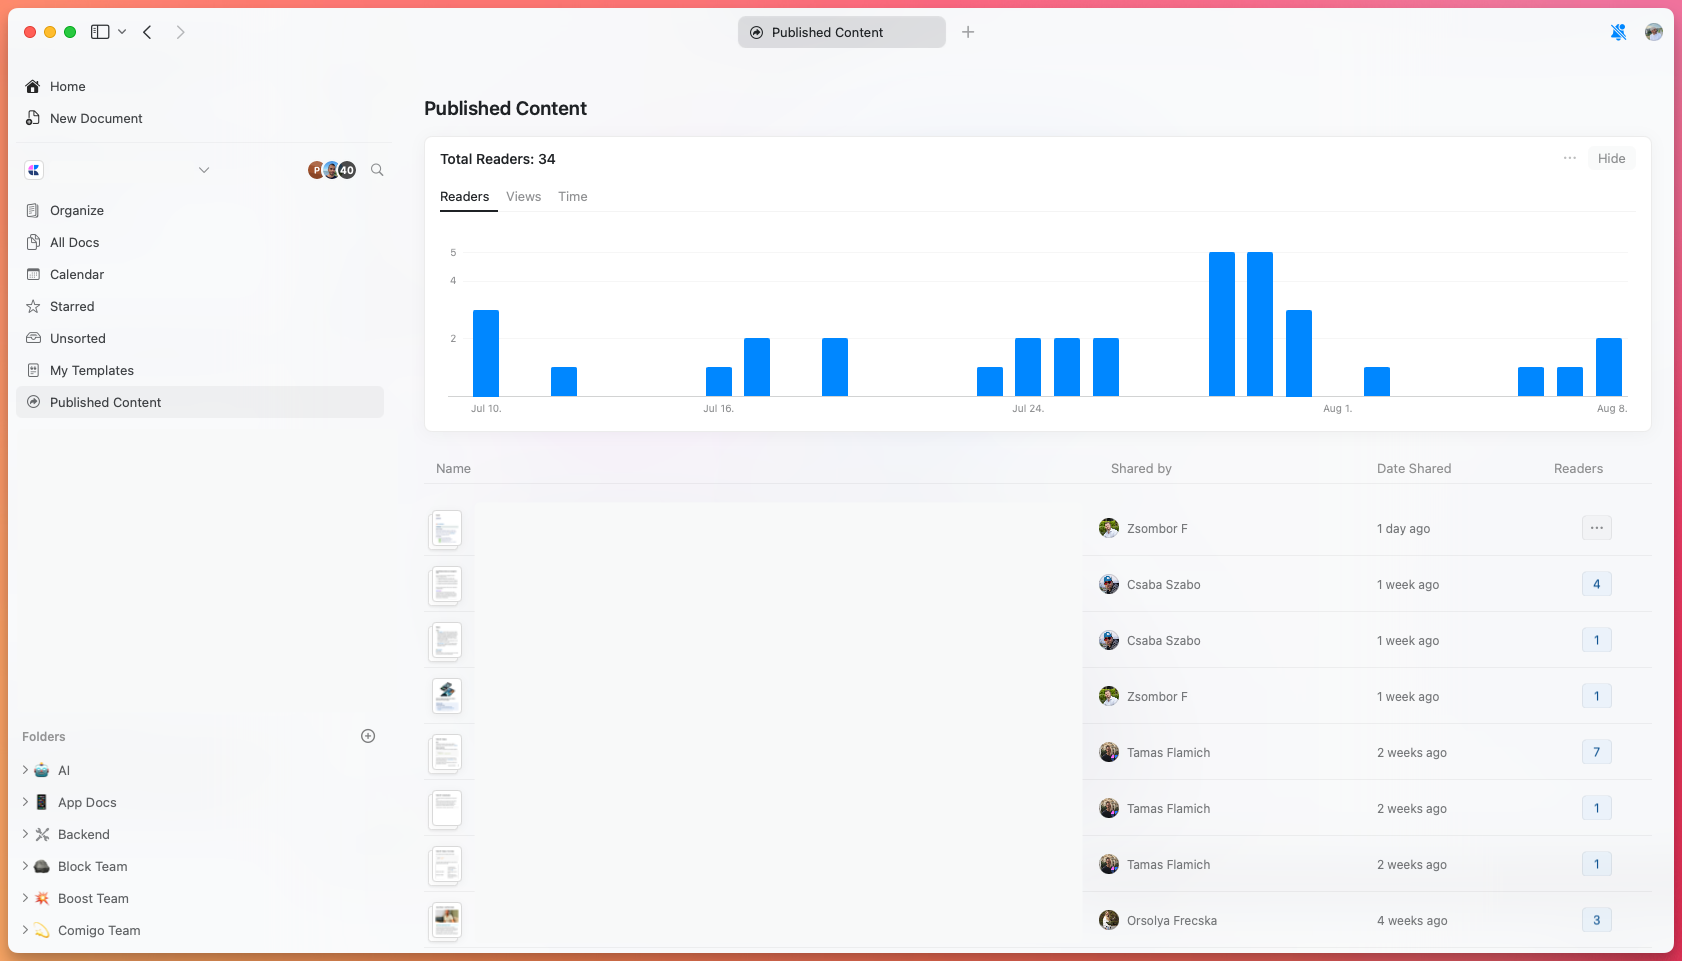
- Total visits across all published content
- Unique viewers for each document
- Average reading time per document
- Quick visit counts for individual documents
Document-Level Analytics
View detailed analytics for a specific published document by clicking the Share button on that document.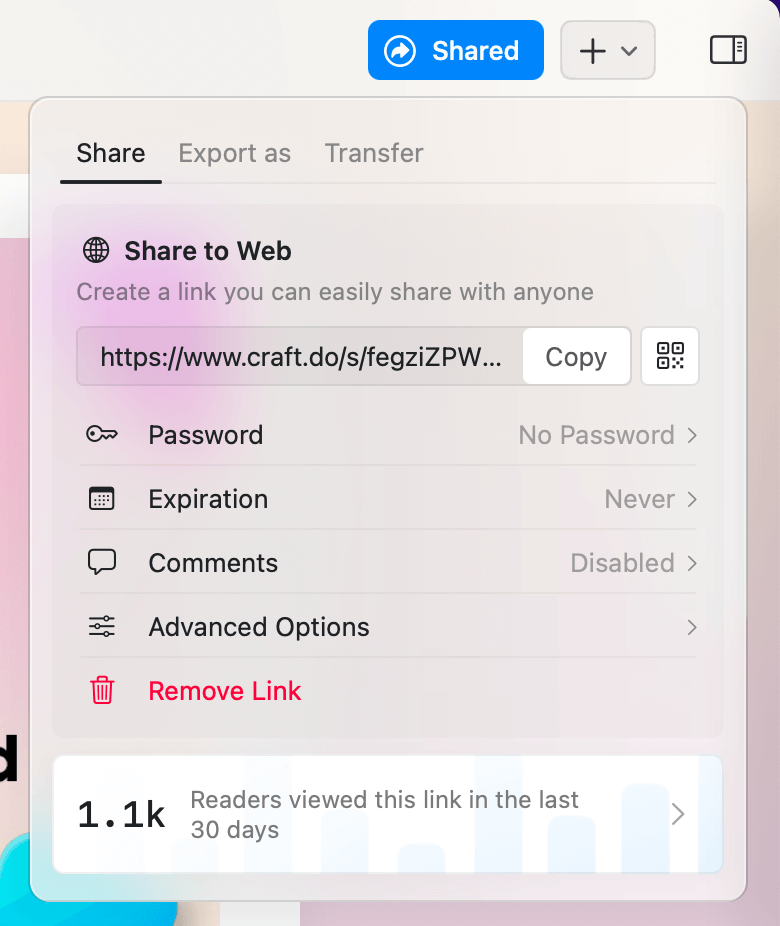
Detailed Analytics View
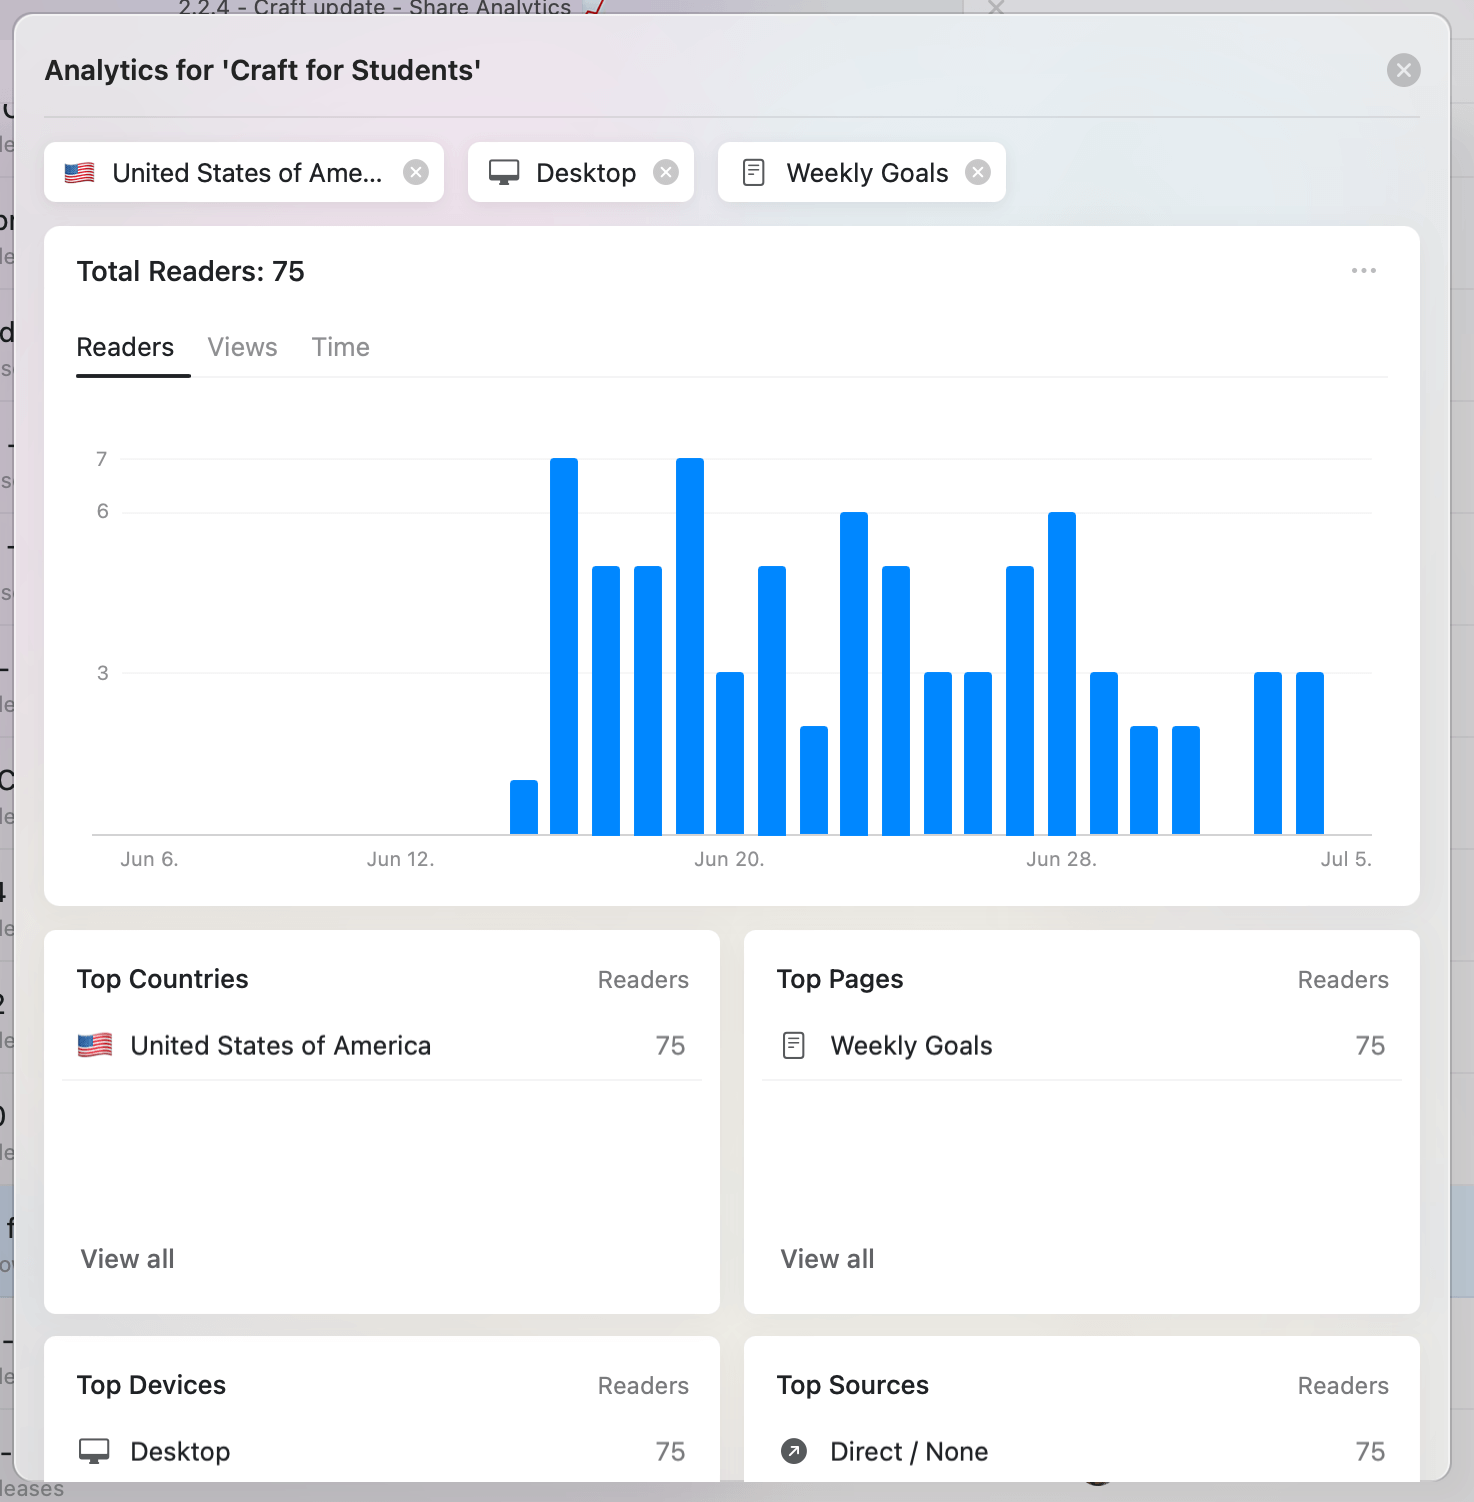
Paid subscribers can access comprehensive analytics with deeper insights into their audience and content performance. Click on any bar in the analytics chart or use the View Analytics option to open the detailed view: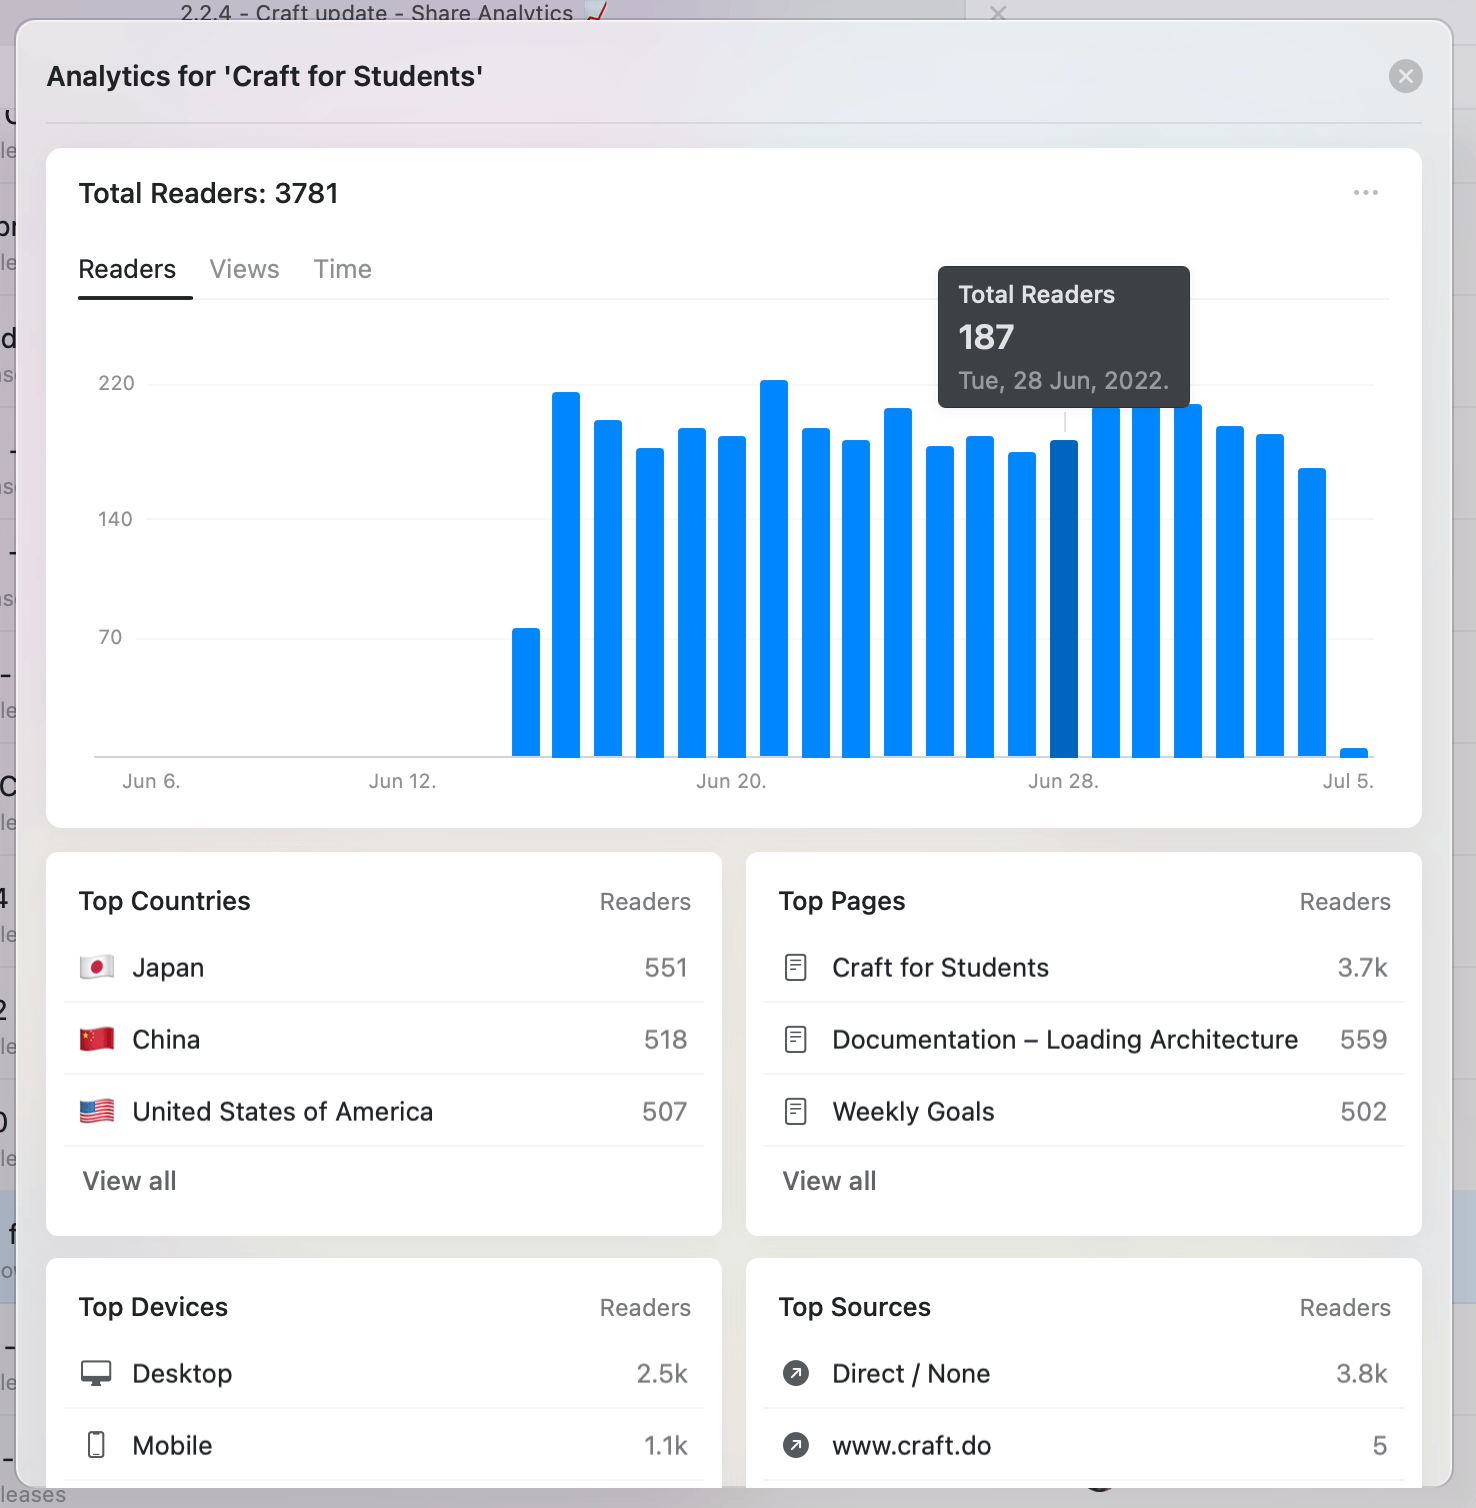
Analytics Widgets
The detailed view includes four key widgets: Top Countries - Geographic distribution of your readers Top Pages - Most viewed pages and subpages within your document Top Devices - Breakdown by Desktop, Mobile, Tablet, and Other Top Sources - Referral sources driving traffic to your document (search engines, social media, direct links, etc.)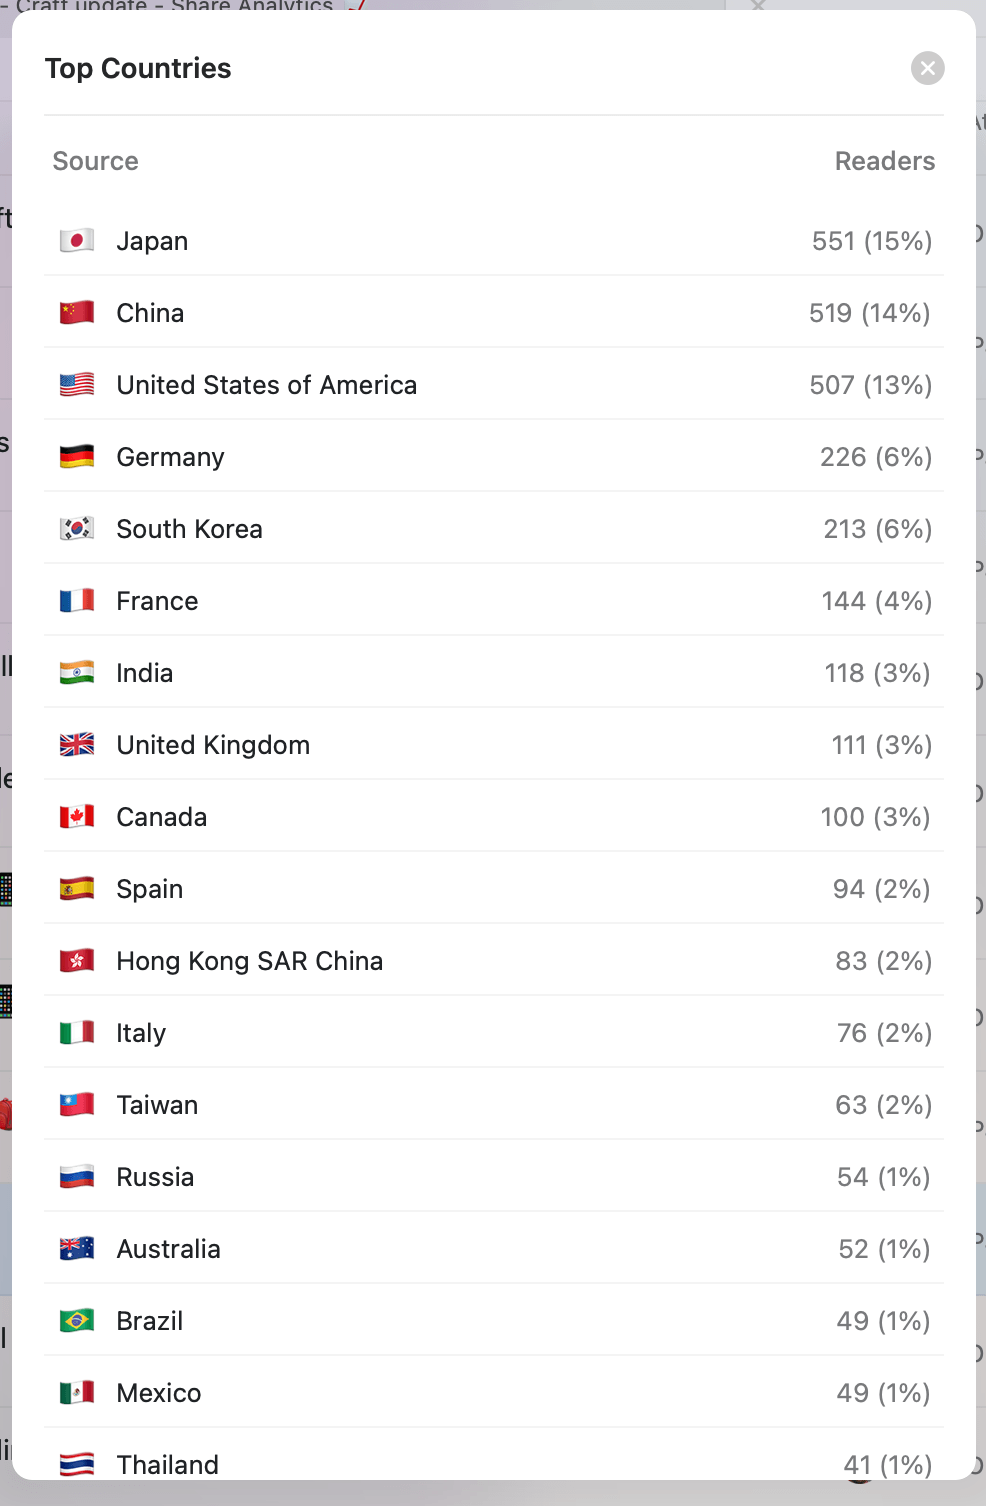
Filtering Data
Every widget item can be used as a filter to drill down into specific audience segments:- Click any day in the bar chart to view that specific day
- Combine multiple filters (country + device + page) for detailed analysis
- Click View All in any widget to see the complete list for that category
How Analytics Work
Privacy-First Approach
Craft analytics are designed with privacy as a core principle:- No cookies - Craft doesn’t set cookies or track users across sites
- No personal data - No personally identifiable information is collected or stored
- Device counting - Analytics count device views, not individual people
- GDPR compliant - No consent banners needed for your readers
What Data is Collected
Craft collects only the following information:- URL of the requested page (from Craft servers)
- Device operating system
- Browser type
- Country-level location (based on IP address)
- HTTP referrer (source of traffic)
- Share or sell data to third parties
- Use data for advertising
- Track readers across multiple sites
- Store personally identifiable information
Reading Time Calculation
Reading time is measured accurately while respecting user privacy:- Pages record when they’re first loaded
- Updates are sent every minute while the browser tab is active
- Reading pauses when the tab loses focus, device sleeps, or user switches apps
- Maximum session time is capped at 30 minutes
- Single-page views count as reads (not bounces with zero time)
Reader Counting
Analytics count device views, not individual people:- Each device accessing your document counts as a separate “reader”
- One person viewing on laptop, phone, and tablet appears as 3 readers
- This approach protects privacy while providing useful insights
- Most cases are reasonably accurate for understanding audience size
Frequently Asked Questions
Are analytics free?
All Craft users can see page views for the last 30 days. Paid subscribers (Plus, Family, Team, Business) get access to detailed metrics including:- Unique readers count
- Average reading time
- Geographic distribution (countries)
- Subpage views
- Device breakdown
- Traffic sources
- Advanced filtering on all metrics
How quickly does data appear?
Data typically arrives in under 5 minutes, but in some cases may take up to 30 minutes to flow through Craft’s systems.Why don’t I see expected activity?
Several factors can affect data visibility:- Processing delay - Wait up to 30 minutes for data to appear
- Ad blockers - Some ad blockers prevent analytics data from being sent
- Bot filtering - Craft filters out known bots, which may occasionally filter real readers (they can still view the document)
What happens when I unpublish a document?
Analytics data remains permanently even after unpublishing. The data will still appear in the Published Content folder summary. If you republish the same document later, all historical data is retained. To reset analytics to zero, create a new copy of the document with a fresh published link.Can I reset analytics for a document?
You cannot reset analytics for an existing published link. To start fresh, make a new copy of the document and publish it with a new link.Seeing multiple readers for a password-protected document?
Remember that Craft doesn’t track people across devices. If one person views your document on multiple devices (laptop, phone, tablet), they appear as multiple readers in the analytics.Publishing Documents
Learn how to publish documents to the web
Custom Domains
Use your own domain for published content